MeteoData
Created lunes 12 diciembre 2016
Lightning
https://www.lightningmaps.org/extra/coverage out of coverage!
http://wwlln.net/TOGA_network_global_maps.htm
http://wwlln.net/new/map/
http://wwlln.net/climate/
WWLLN Data available
WWLLN Monthly CDs containing all stroke locations over the whole world for 1 month. These are mailed to subscribers each month, or they may opt to download the data weekly. Archival data are available for sale from August 15, 2004 to the present. Our site hosts receive a free monthly subscription.
WWLLN Data are available via internet with cadence every 10 minutes for research purposes from the University of Washington, or with a cadence of as fast as every minute (i.e. in realtime) from our commercial reseller. Contact Prof. Holzworth for more info.
Contact
for all questions relating to WWLLN:
Prof Robert Holzworth, Earth and Space Sciences, University of Washington
bobholz@washington.edu
Global Lightning Network (GLN)
http://www.unidata.ucar.edu/data/lightning/gln.html
para datos redirije a http://www.uspln.com/education.html y parece que no es gratuito
Other links
http://geology.com/articles/lightning-map.shtml
https://lightning.nsstc.nasa.gov/

http://geology.com/records/lightning-hotspots/
https://lightning.nsstc.nasa.gov/data/data_lis-otd-climatology.html
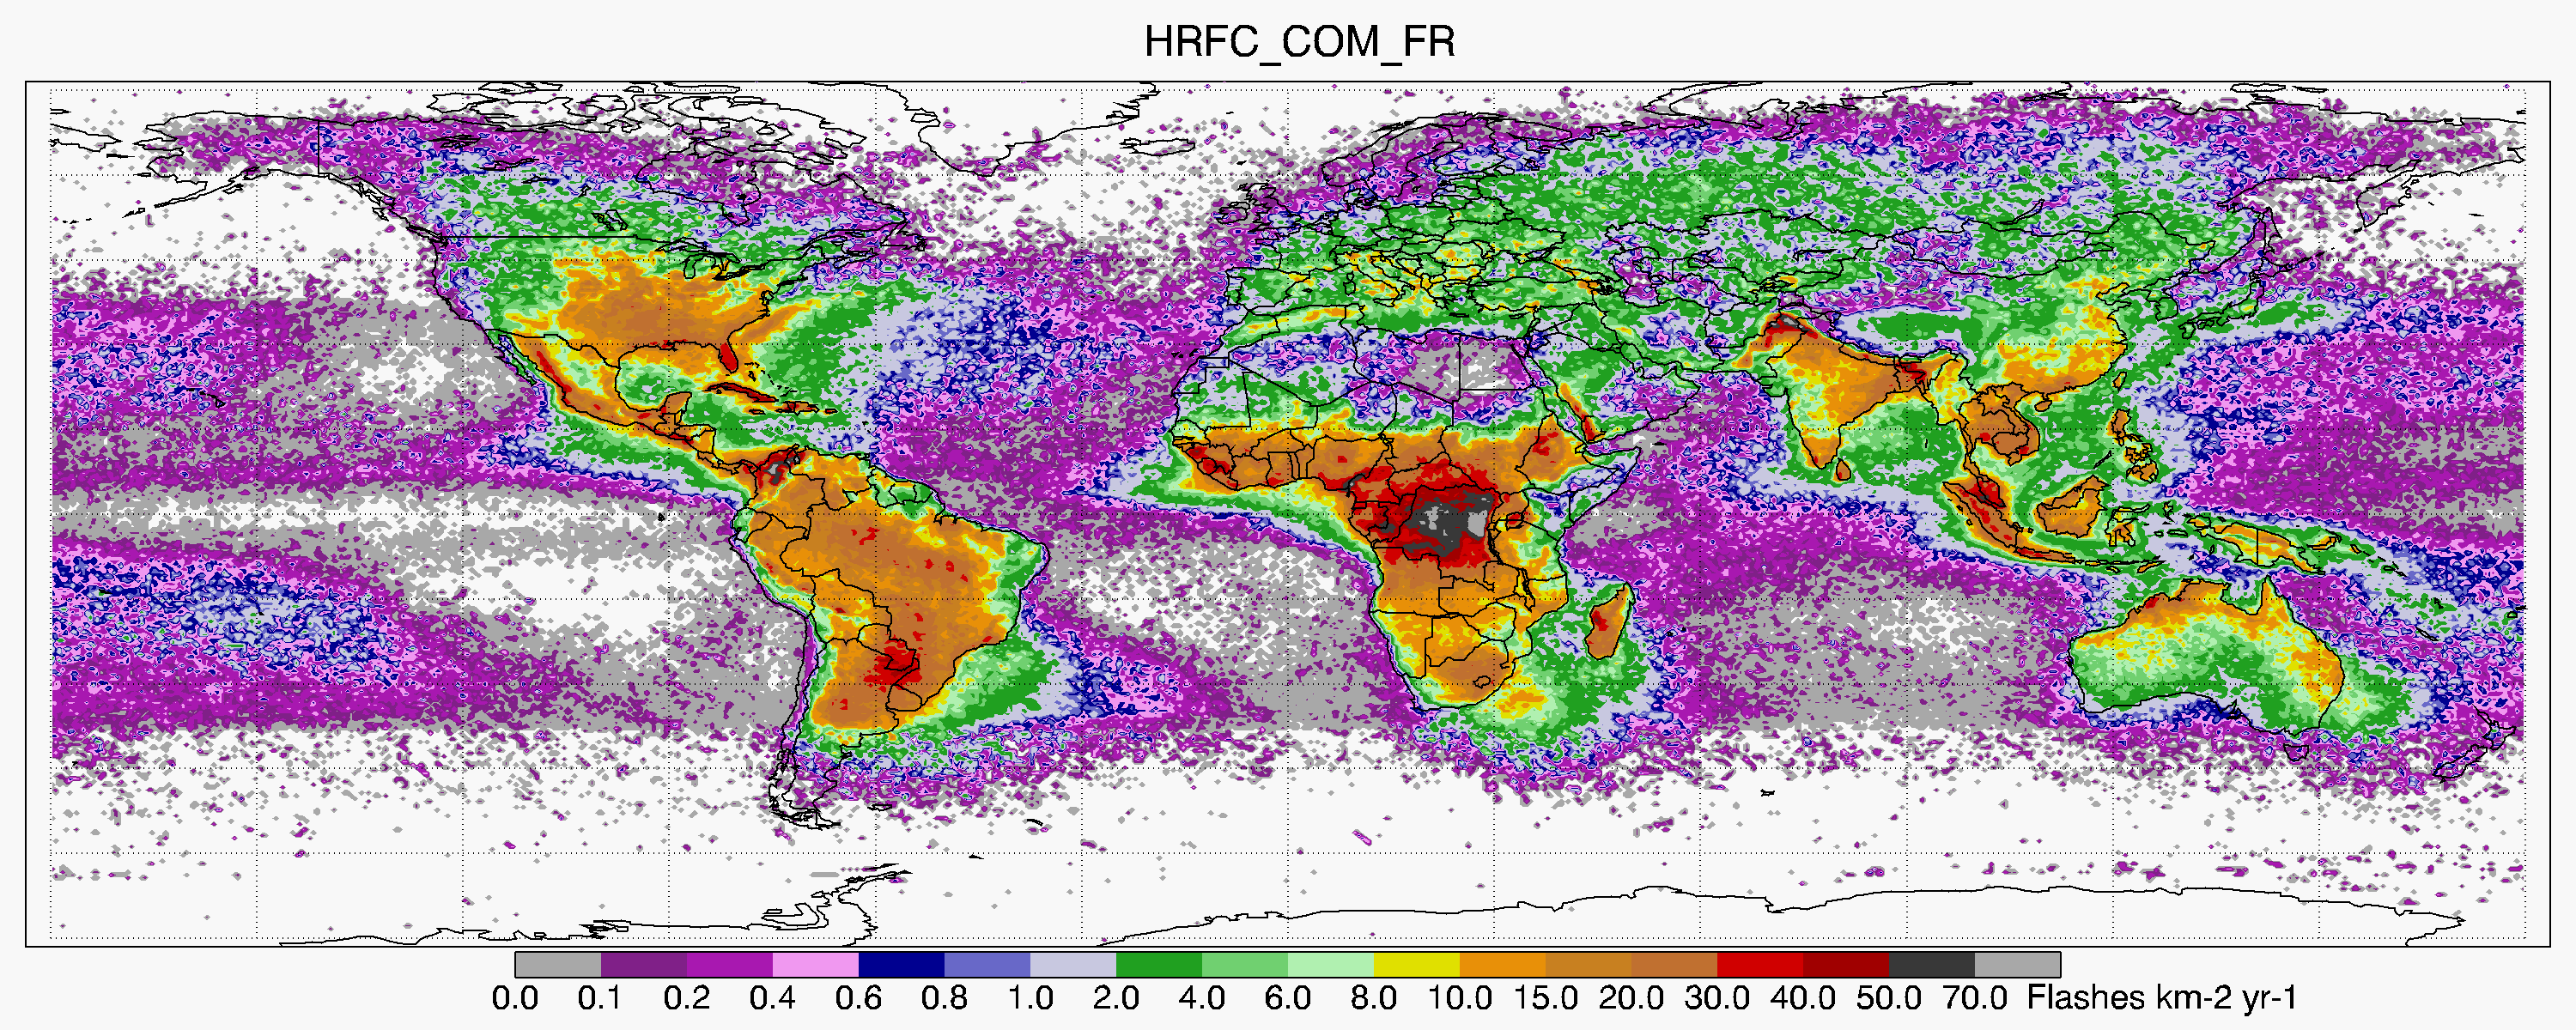
https://ghrc.nsstc.nasa.gov/pub/lis/climatology/LIS-OTD/HRFC/browse/HRFC_COM_FR_V2.3.2014.png
2016-12-12 Descargo de https://ghrc.nsstc.nasa.gov/hydro/details.pl?ds=lolrmts
- /media/alobo/LACIE500/GranSabanaDownload/Lightning/LISOTD_LRMTS_V2.3.2014.hdf
- /media/alobo/LACIE500/GranSabanaDownload/Lightning/LRMTS_COM_V2.3.2014.mov

https://ghrc.nsstc.nasa.gov/hydro/details.pl?ds=lolrmts
Appropriate Climate Data
we used GISTEMP temperature anomalies [Hansen et al., 1999] in combination with the CRU 1961 – 1990 temperature climatology [New et al., 1999] and TRMM precipitation as data sources (Van der Werf et al. 2008. Climate controls on the variability of fires in the tropics and subtropics. Global Biogeochemical Cycles 22: GB3028.)
- Reanalysis ERA, ECMWF,NCEP...
Temperature
- Global Temperature Data Sets: Overview & Comparison
- U. Delaware: 1900 - 2014 monthly 0.25 x 0.25
- https://climatedataguide.ucar.edu/climate-data/global-land-precipitation-and-temperature-willmott-matsuura-university-delaware
- http://climate.geog.udel.edu/~climate/html_pages/download.html#T2011
- Terrestrial Air Temperature: 1900-2014 Gridded Monthly Time Series (V 4.01)
- Downloaded to /media/alobo/LACIE500/GranSabanaDownload/MeteoClimate/TempUDEL
- Terrestrial Precipitation: 1900-2014 Gridded Monthly Time Series (V 4.01)
- Downloaded to /media/alobo/LACIE500/GranSabanaDownload/MeteoClimate/PrecipUDEL
- Willmott and Feddema's Moisture Index Archive: Monthly Time Series (1900 - 2014) (V. 3.01) 0.5 x 0.5
- NASA GISTEMP: 1880 - 2016 monthly 2x2
- http://data.giss.nasa.gov/gistemp/ Gridded Monthly Maps of Temperature Anomaly Data
- Users interested in the entire gridded surface air temperature anomaly data may download netcdf files containing selected series on a regular 2°×2° grid or the basic SBBX binary files. Note: These files are large.
- CRUTEM4: 1850 - 2016 monthly 5x5
- HadCRUT4 (CRUTEM4 + SST)
- NOAA MLOST 1871- 2016 monthly 5x5
- BEST Berkeley 1701 - 2013 day/month 1x1
- PSD Gridded Climate Datasets: Surface Temperature http://www.esrl.noaa.gov/psd/data/gridded/tables/temperature.html
TRMM
- Busqueda TRMM y seleccion de precipitacion en EarthData
- TRMM 3B31 (as in Libonati et al. 2015) 1997 - 2015 monthly 0.5 x 0.5
- http://disc.gsfc.nasa.gov/uui/datasets/TRMM_3B31_V7/summary
- TRMM_3B31: TRMM TMI/PR Combined Precipitation L3 1 month 0.5 degree x 0.5 degree V7. This is a combined rainfall product. 3B31 uses the high quality retrievals done for the narrow swath in 2B31 to calibrate the wide swath retrievals generated in 2A12. For each 0.5 degree box and each vertical layer, an adjustment ratio is calculated for the swath overlap region for one month. Only TMI pixels with 2A12 pixelStatus equal to zero are included in monthly averages, which effectively removes sea ice.
- https://disc2.gesdisc.eosdis.nasa.gov/data/TRMM_L3/TRMM_3B31.7/
- TRMM_3B42_Daily V7 1998-01-01 to Present dayly 0.25 degree x 0.25
- TRMM (TMPA) Precipitation L3
- http://disc.gsfc.nasa.gov/uui/datasets/TRMM_3B42_Daily_V7/summary?keywords=TRMM&start=1920-01-01&end=2016-12-15
- This daily accumulated precipitation product is generated from the research-quality 3-hourly TMPA (3B42). It is produced at the NASA GES DISC, as a value added product. Simple summation of valid retrievals in a grid cell is applied for the data day. The result is given in (mm). The beginning and ending time for every daily granule are listed in the file global attributes, and are taken correspondingly from the first and the last 3-hourly granules participating in the aggregation. Thus the time period covered by one daily granule amounts to 24 hours, which can be inspected in the file global attributes.
- TRMM_3B43: TRMM (TMPA/3B43) Rainfall Estimate L3 1 month 0.25 degree x 0.25 degree V7
- 1998-01-01 to Present monthly 0.25 x 0.25
- The 3B43 dataset is the monthly version of the 3B42 dataset.
- https://disc.gsfc.nasa.gov/uui/datasets/TRMM_3B43_V7/summary?keywords=TRMM&start=1920-01-01&end=2016-12-15
- Doc https://disc2.gesdisc.eosdis.nasa.gov/data/TRMM_L3/TRMM_3B43.7/doc/TRMM_Readme_v3.pdf
- Sofia: extract 3B43 info from that pdf
- Download HDF format: https://disc2.gesdisc.eosdis.nasa.gov/data/TRMM_L3/TRMM_3B43.7/
- Download bin format: ftp://disc2.nascom.nasa.gov/data/TRMM/Gridded/
- TRMM-based precipitation estimates-A series of quasi-global, near-real-time, TRMM-based precipitation estimates is available to the research community via anonymous ftp . The estimates are provided on a global 0.25 ° x0.25 ° grid http://trmm.gsfc.nasa.gov/data_dir/data.html
A TRMM-calibrated merger of all available TMI, AMSR-E, SSM/I, and AMSU-B precipitation estimates (three-hourly accumulations).
A geosynchronous infrared estimate which is calibrated by the merged-microwave data (hourly estimates).
A combination of the first two fields (three-hourly accumulations).
The data are available under ftp:trmmopen.gsfc.nasa.gov/pub/merged. Users are urged to download the README first for additional details. Users are urged to download the README first for additional details. This site provides both Version 6 (V06) and Version 7 (V07) products, but the obsolete V06 is only intended to assist users in completing old studies. In most other cases, V07 should be used.//
- All Data Products
3G: Provides gridded text data in daily files. Directories include:
3G01-4: Channel 4 VIRS
3G01-5: Channel 5 VIRS
3G68: 0.5 x 0.5 degrees
3G68Land: Australia, South America, Africa at 0.1 x 0.1 degrees
3G68-Q: 0.25 x 0.25 degrees
ByDate: Full HDF Files for each product arranged by date.
ByInstrument: Full HDF Files for each product, arranged by date.
GIS: PPS has developed prototype files of TRMM’s 3B42 Product in TIF files, which is compatible with Geographic Information Systems (GIS). Data are arranged as 50°N-S time slices for each year, month, and day. More information on GIS Prototypes from PPS is available here. All products may also be obtained through STORM.
For information about Precipitation Feature (PF) products, please visit the University of Utah website.
- ENSO *Dry season (June-October) multivariate ENSO index (MEI, http://www.cdc.noaa.gov/people/klaus.wolter/MEI/mei.html http://www.esrl.noaa.gov/psd/enso/mei/index.html (Van der Werf et al. 2008. Climate regulation of fire emissions and deforestation in equatorial Asia. Proceedings of the National Academy of Sciences 105: 20350–20355)
- SOI http://www.cgd.ucar.edu/cas/catalog/climind/soi.html (Hoffmann, 2003 et al. Regional feedbacks among fire, climate, and tropical deforestation. Journal of Geophysical Research: Atmospheres 108: 4721)
- meteorological data obtained from the Centro de Previsao do Tempo e Estudos Climaticos (CPTEC/INPE,Figure 1b).
- Input Data del TEM en ecosystems.mbl.edu/TEM/index.html
- WorldClim 1.4: Current conditions (~1960-1990)
- http://www.worldclim.org/current
- variables at 10 minutes 5 minutes 2.5 minutes 30 seconds
- minimum temperature (°C * 10)
- maximum temperature (°C * 10)
- average temperature (°C * 10)
- precipitation (mm)
- bioclimatic variables